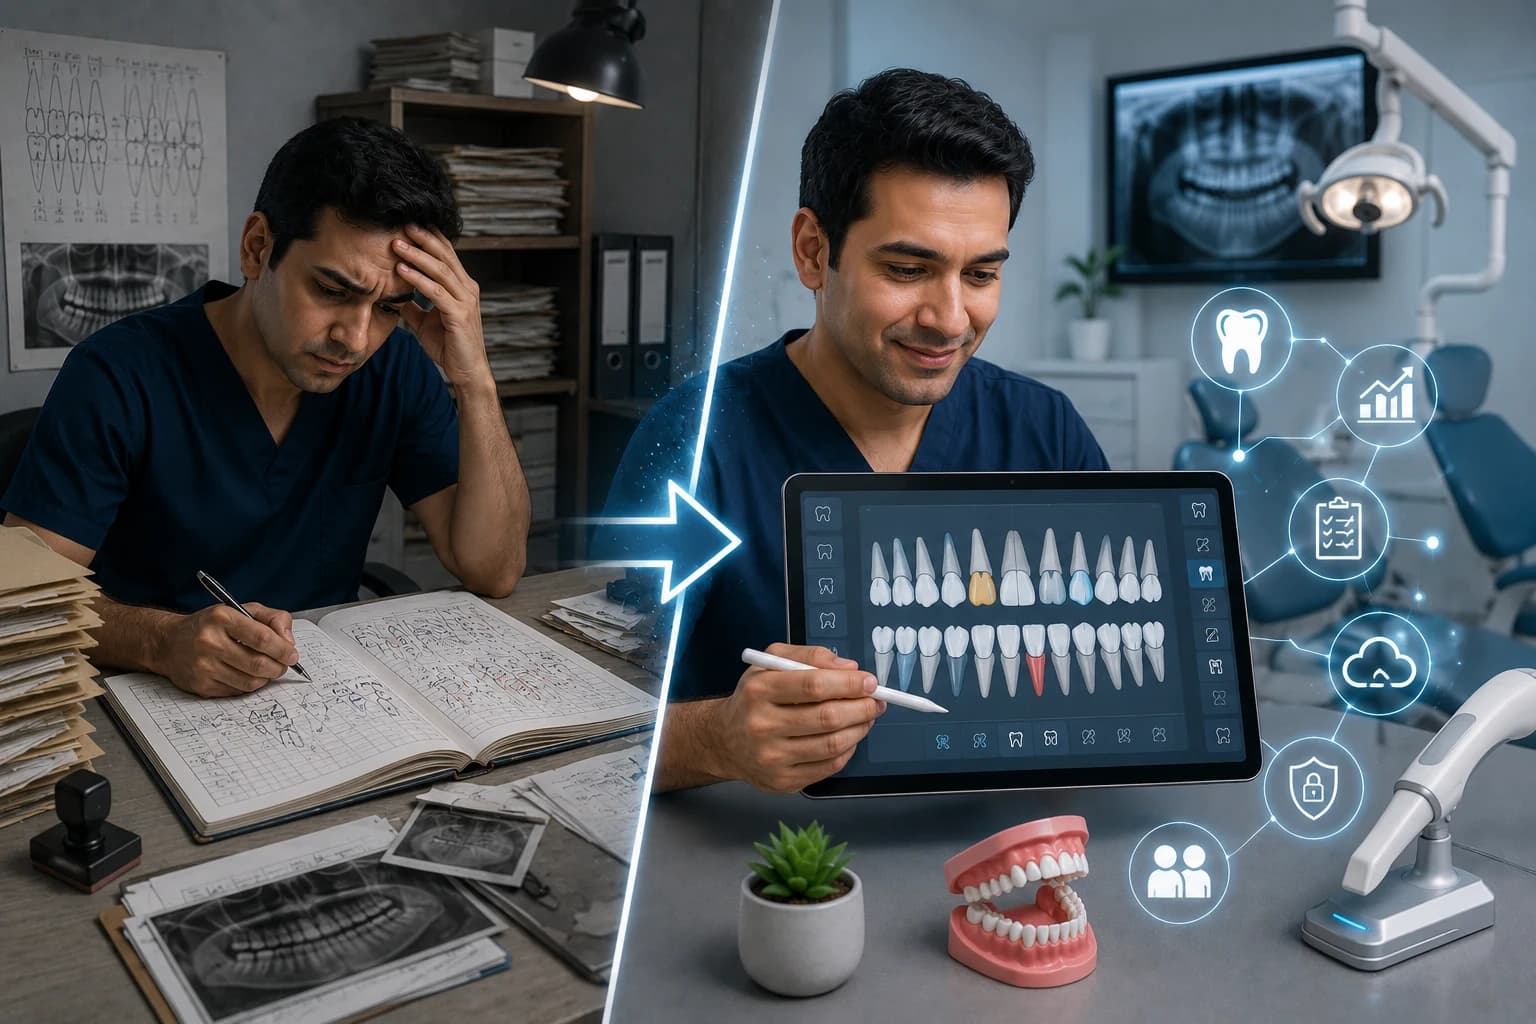
The Power of Digital Tooth Chart: Why Every Dentist Needs It
Paper odontograms fail audits 44% of the time. Digital tooth charts cut documentation time, boost case acceptance, and protect your license — with data from 1,128-chart UK audits and 2025 clinical studies.
Quick answer
Digital tooth charts in dental patient records software link procedures to billing and reduce charting errors versus paper odontograms. Denzif includes odontogram charting on the Pro plan.
Your nurse reads the paper chart. The MO composite on tooth 36 is recorded as DO. The patient asks why you are treating a tooth that "was already fixed last year." You pull the file — two different versions of the same chart, neither complete.
That scenario is not rare. It is documented. In an audit of 1,128 general dental practice records in the UK, researchers found 44% of dental charts were inaccurate (individual practices ranged from 16% to 83% error rates). Missed amalgam restorations appeared in 13% of charts; missed tooth-coloured restorations in 18%; wrong surfaces in 5–9% of cases (PubMed audit, 2017).
If you still chart on paper — or mix paper with scattered photos — you are carrying clinical risk, lost production, and weaker treatment acceptance than clinics running a digital tooth chart inside their practice management system.
This guide explains seven reasons every dentist needs a digital odontogram in 2026, with numbers from peer-reviewed audits and recent clinical literature — plus a practical rollout plan for small and multi-chair clinics in Pakistan.
1. Paper Charts Fail Audits — 44% Inaccuracy Is the Benchmark
Dental charting is a legal record, not a sketch. Defence organizations and regulators expect charts that match what is in the mouth.
The landmark UK audit of 1,128 patients across 14 dentists reported:
- 44% overall chart inaccuracy
- 5% of charts with too many teeth recorded; 5% with too few
- 13% missed amalgam restorations; 18% missed composite restorations
- 7.5% charted amalgams that were not actually present
Other record audits reinforce the pattern: university hospital reviews using CRABEL scoring show only 7.4% of records achieved 100% compliance, with widespread gaps in history, examination, and treatment documentation (PMC audit, 2023).
Digital tooth charts use standardized symbols, mandatory fields, and tooth-level locking — cutting illegibility and "chart drift" between visits.
2. You Reclaim 5–8 Minutes Per Patient (≈1 Hour of Production Daily)
Manual charting means writing, filing, and later deciphering notes. Integrated digital charting with templates and structured entry routinely saves 5–8 minutes per patient in workflow analyses — for a dentist seeing 12–16 patients daily, that is 60–128 minutes redirected to dentistry or earlier finishes.
Time savings compound across roles:
- Dentists: tap surfaces instead of drawing; auto-link procedures to teeth
- Hygienists: digital perio without a second recorder when voice or tablet workflows are enabled
- Front desk: no pulling paper files for every checkout question
A 2025 BMC Oral Health randomized crossover trial in pediatric patients found digital scans took 3.56 ± 0.38 minutes versus 7.71 ± 0.36 minutes for conventional rubber-base impressions — 80% of children preferred digital (P < 0.001). While that study focused on impressions, it reflects the same patient expectation: faster, clearer, digital-first care (BMC Oral Health, 2025).
3. Treatment Acceptance Rises When Patients See Their Mouth
Patients do not understand "MOD composite on 46." They understand a color-coded tooth map next to an intraoral photo.
Practices with poor communication see 40–50% treatment acceptance; practices that combine visual plans with plain language often exceed 60–70%. A digital odontogram becomes the shared screen during case presentation:
- Highlight diseased surfaces in red
- Show completed work in blue
- Sequence phased plans (urgent vs elective)
When acceptance rises 10 percentage points on $80,000 monthly production, that is $96,000+ annual revenue without new chairs.
4. Continuity Across 3 Dentists and Locum Coverage
In multi-dentist clinics, paper charts become personal shorthand. Dr. A's notation confuses Dr. B; locum dentists re-chart from scratch, wasting 15–20 minutes and sometimes re-ordering imaging.
A single cloud odontogram gives every provider the same:
- FDI or Universal tooth numbering
- Surface notation (M, O, D, B, L)
- Treatment history by tooth
- Attached radiographs and photos
That is operational insurance when staff turnover affects 90% of dental practices (ADA workforce surveys cited in industry reports).
5. Billing and Treatment Plans Stop Drifting Apart
Disconnected charting creates revenue leakage:
- Procedure performed but not billed
- Billed tooth not matching clinical notes
- Insurance disputes from incomplete documentation
Digital charts that link teeth → treatment records → invoice line items close the loop. When your odontogram says "#14 root canal," the billing module should already know the code, fee, and consent status.
Industry billing guides target 98%+ net collection rates; documentation gaps are a top driver of 91–95% underperformance and AR over 90 days climbing past 15–25% of balances (Dental Billing Assist KPI benchmarks).
6. Forensic and Medico-Legal Protection
When complaints arise, courts and councils ask: What did you record, and when?
Digital systems timestamp entries, restrict retroactive edits (or log them), and preserve audit trails. Paper charts can be lost, altered, or illegible — a finding repeated in forensic dentistry literature and UK GDC guidance referenced in the 1,128-chart audit.
Accurate charting is not bureaucracy; it is professional indemnity hygiene.
7. You Build the Foundation for AI, Imaging, and 3D Workflows
A 2025 review in the International Journal of Medical Sciences notes digital dentistry — AI diagnostics, intraoral scanning, CAD/CAM, AR/VR — depends on structured, interoperable data at the tooth level (IJMS, 2025).
Clinics still on paper in 2026 can still practice excellent dentistry — but they cannot plug into the efficiency curve digital-native offices are riding:
- Automated recall by tooth condition
- AI-assisted note drafts from chart context
- Lab exports from digital prep records
Your odontogram is the schema everything else attaches to.
Pakistan Clinic Context: WhatsApp, Multi-Chair, Intermittent Power
Urban Pakistani practices often run 2–4 chairs and 2–3 dentists with heavy WhatsApp communication. A digital chart enables:
- Screenshot or PDF treatment maps patients understand (in Urdu/English captions)
- Consistent numbering when patients switch between branches
- Offline-tolerant software that syncs when connectivity returns (choose vendors that support this)
Pair digital charting with automated WhatsApp reminders (40–60% no-show reduction in documented cohorts) and multi-dentist chair scheduling so the front desk stops re-asking clinical questions the chart should answer.
30-Day Rollout: Paper to Digital Charting
Week 1 — Template & standards
- Pick FDI vs Universal numbering for the whole clinic
- Build 10 procedure templates (exam, scaling, composite, RCT, crown, extraction, etc.)
- Train every dentist on required fields before sign-off
Week 2 — Active patients
- Digitize charts for patients seen in the last 90 days (top 150–300 files)
- Scan perio charts at hygiene visits only (do not boil the ocean)
Week 3 — New patients digital-only
- Ban new paper charts; scan legacy only when patient returns
Week 4 — Audit
- Random 20-chart audit monthly; target <10% critical errors
- Review treatment acceptance and average documentation time
The Bottom Line
The question is not whether digital charting is "nice to have." 44% manual chart inaccuracy in a published audit of 1,128 records is your warning sign. Add 5–8 minutes saved per patient, stronger case presentation, and billing alignment — and the ROI exceeds most capital purchases.
About Denzif
Denzif is cloud dental practice management for established small-to-mid clinics in Pakistan — patients, appointments, treatments, billing, inventory, WhatsApp reminders, and optional AI on Standard. Get custom PKR pricing or request a private walkthrough.
Frequently Asked Questions
A digital tooth chart — also called an odontogram — is an interactive diagram of the patient's dentition in your practice software. You mark caries, restorations, missing teeth, and periodontal findings with standardized symbols. It updates in real time, links to treatment plans and billing, and stays readable for every clinician on the team.
Ready to put this into practice?
Custom PKR pricing for established clinics. Private walkthrough after we confirm fit. Setup in about 15 minutes.