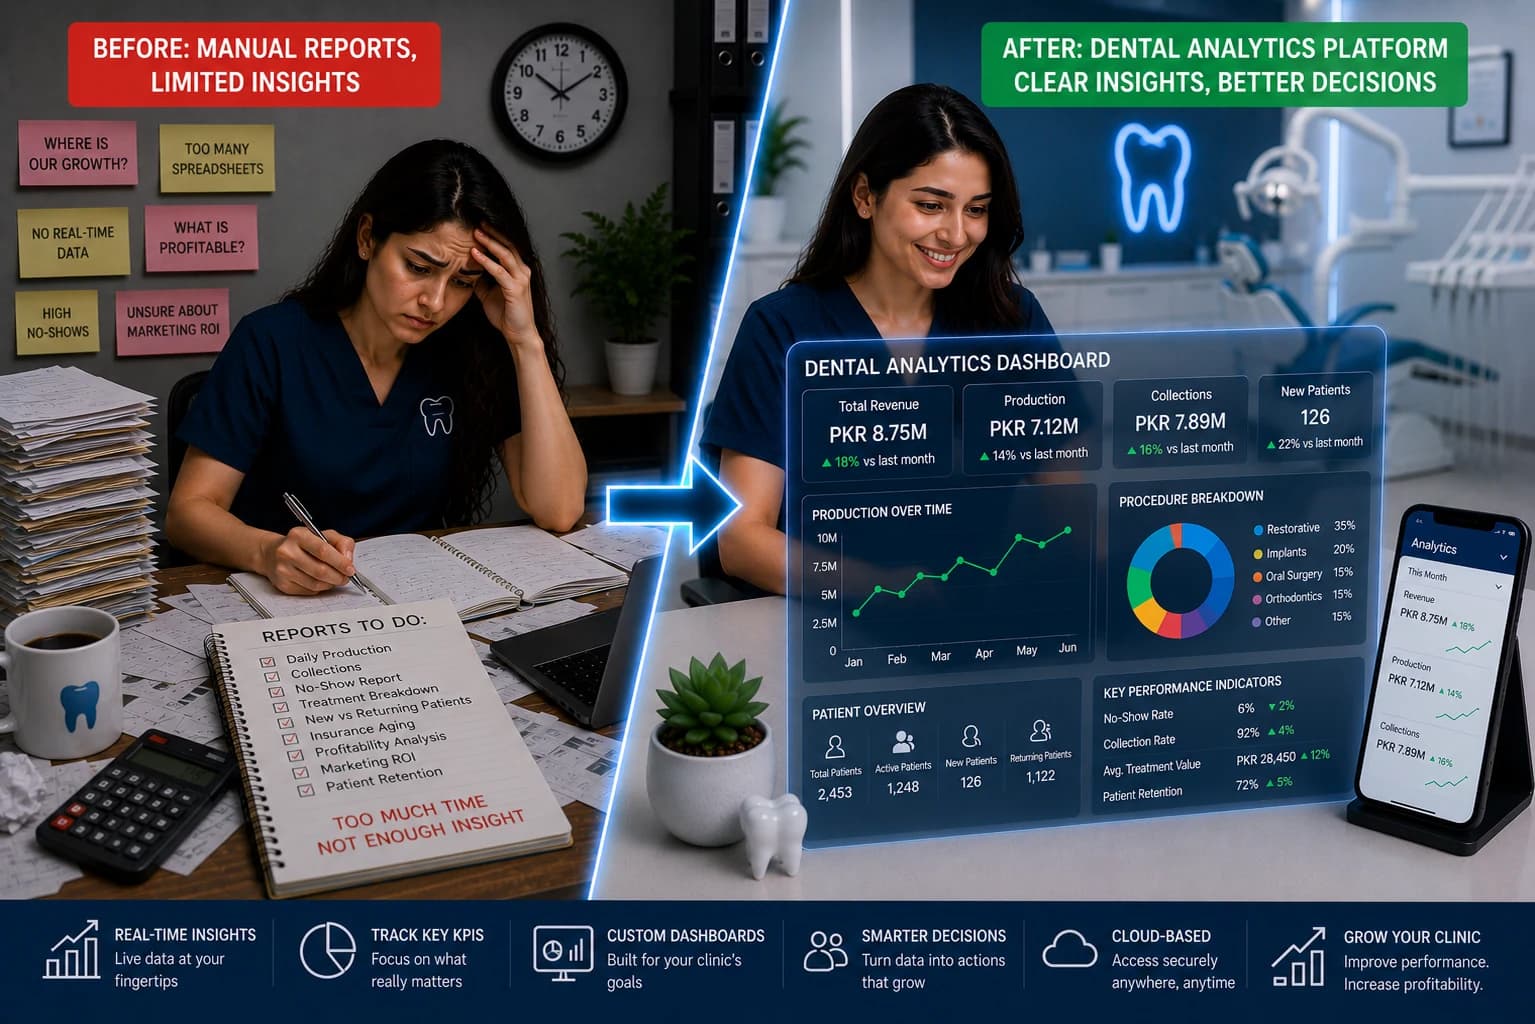
Dental Clinic KPIs: The 10 Numbers Every Owner Should Track (2026)
Most owners track production only — and miss the nine KPIs that predict cash flow. The 10 dental clinic metrics to review weekly, with targets and fixes.
Quick answer
The 10 dental clinic KPIs every owner should track weekly are production vs goal, collection rate, case acceptance, hygiene reappointment, no-show rate, new patients, production per provider hour, unscheduled treatment value, chair utilization, and pending payments aging. Practices that review this set cut revenue leaks 40% faster than month-end guesswork.
You cannot fix what you do not measure — yet most dental clinic owners still run on gut feel and a monthly production printout.
The gap is not effort. It is which numbers you watch. Production alone tells you what happened last month. The ten KPIs below tell you what will break next week — and which lever to pull first.
This guide lists the metrics worth a weekly 15-minute review, industry targets, and the operational fix behind each red flag. For platform comparisons, see the dental analytics platform guide.
Key takeaways
- Track 10 KPIs weekly — not 600 vanity metrics from a legacy report library.
- No-show rate and unscheduled treatment value are the fastest cash levers for independents.
- Collection rate below 95% means billed work is not becoming revenue — often a front-desk process issue, not clinical.
- Case acceptance under 50% signals communication failure, not case difficulty.
- Practices reviewing KPIs weekly identify revenue gaps 40% faster than month-end-only reviews (ADA Health Policy Institute — cited in industry analyses).
- Denzif Pro includes dental practice analytics — revenue, aging, no-shows, exports — at custom PKR pricing (custom PKR pricing).
The 10 dental clinic KPIs (with targets)
| # | KPI | Target | Red flag |
|---|---|---|---|
| 1 | Production vs monthly goal | 95–105% | Below 85% by mid-month |
| 2 | Collection rate | 95%+ of net production | Below 90% two months running |
| 3 | Case acceptance rate | 60–75% | Below 50% |
| 4 | Hygiene reappointment rate | 85–90% | Below 75% |
| 5 | No-show rate | Under 8% | Above 12% |
| 6 | New patient count | Steady vs prior month | Drop >20% without seasonal reason |
| 7 | Production per provider hour | Rising or stable | Declining 3+ weeks |
| 8 | Unscheduled treatment value | Trending down | Growing pile month over month |
| 9 | Chair utilization | 70–85% | Below 60% with full staff |
| 10 | Pending payments (aging) | <10% over 30 days | Rising udhaar / partial balances |
Keep this table on one screen. That is your dashboard — everything else is optional until these ten are green.
KPI 1–2: Production and collections
Production vs goal
Set a realistic monthly production target per chair and provider. Mid-month, you should be near 50% of goal — not discovering a shortfall on the last Friday.
Fix when red: Open tomorrow's schedule. Are high-value blocks empty? Move recall patients into gaps. See appointment scheduling best practices.
Collection rate
Production is vanity if patients do not pay. Collection rate = cash collected ÷ net production (adjust for insurance timing if applicable).
Fix when red: Issue digital invoices at checkout, send payment links via WhatsApp same day, and review aging weekly — not monthly. Smart billing workflows cut pending balances 15–30% in most cash-pay clinics.
KPI 3–4: Case acceptance and hygiene reappointment
Case acceptance
Presented treatment that patients decline is lost revenue you already earned clinically — through diagnosis time and trust.
Fix when red: Use visual treatment plans, itemized estimates before procedures over PKR 15,000 (~$50), and plain-language summaries sent after the visit. Target 60–75% acceptance on presented plans.
Hygiene reappointment
Patients who leave without their next cleaning booked drift away. Reappointment rate = patients who scheduled their next hygiene visit before leaving ÷ total hygiene patients seen.
Fix when red: Book the next visit before they stand up. Automated recall catches the rest — see dental patient recall system.
KPI 5–6: No-shows and new patients
No-show rate
No-shows = missed appointments ÷ total scheduled. Industry average runs 8–15%; top performers hit 4–6% with automated reminders.
Fix when red: Confirmation at booking, 24-hour WhatsApp reminder, 2-hour reminder for high-risk patients, one-click reschedule. WhatsApp automation cuts no-shows 30–50% in industry studies.
New patient count
Production flatlines when new patient flow stalls — even if existing patients are loyal.
Fix when red: Track referral source per patient in your PMS. Double down on what works — Google reviews, Instagram, doctor referrals — and fix the front-desk phone script for inbound calls.
KPI 7–8: Provider efficiency and unscheduled treatment
Production per provider hour
Divide provider production by clinical hours worked. Compare dentists fairly — a surgeon doing implants should not be benchmarked against a hygiene-heavy associate.
Fix when red: Audit schedule templates. Are 90-minute blocks used for 30-minute prophies? Are assistants ready before the dentist enters?
Unscheduled treatment value
Export accepted treatment plans with no appointment booked. Sum the dollar (or rupee) total.
Fix when red: Weekly outreach to the top 20 unscheduled cases. A $40,000 pile is three phone calls and two WhatsApp campaigns away from partial conversion — if you can see it.
KPI 9–10: Chair utilization and pending payments
Chair utilization
Available chair time wasted is capacity you already pay rent and salaries for.
Fix when red: Shorten excessive buffer time, use a waiting list for cancellations, and block high-value procedures in prime hours. Multi-chair clinics need per-dentist calendars — see multi-dentist scheduling.
Pending payments aging
Track balances 0–7, 8–30, and 30+ days. Rising 30+ day buckets mean udhaar culture is creeping in.
Fix when red: Partial payment policy in writing, deposit for lab cases, automated payment reminders tied to invoice status.
How to run a 15-minute weekly KPI huddle
1. Pull the ten numbers from your PMS or analytics dashboard — not three spreadsheets.
2. Flag anything outside target in red.
3. Assign one owner and one action per red metric for the coming week.
4. Review last week's actions — did no-shows drop? Did unscheduled value shrink?
Dental Economics recommends limiting huddle metrics to what staff can influence that week — production goal, today's gaps, and no-shows — while owners review the full ten weekly.
Pakistan clinic context
Cash-pay and partial-payment (udhaar) models make collection rate and pending aging especially critical. WhatsApp-first reminders outperform email in urban Pakistan practices. Denzif records partial payments and surfaces pending balances in Pro analytics — no separate KPI tool required.
Multi-location groups should note: Denzif currently serves single-clinic tenants; compare per-location KPIs manually until multi-branch dashboards ship.
Tools: spreadsheet vs built-in analytics
| Approach | Cost | Best for |
|---|---|---|
| Manual Excel | Free + staff time | Single-chair startups under 20 patients/week |
| Standalone analytics | $250–$600/month | US Dentrix shops wanting deep KPI libraries |
| Built-in PMS dashboards | Included in cloud plan | Clinics wanting one bill, live data |
For a full platform comparison, read track profitable treatments and the analytics platform guide.
The Bottom Line
Ten KPIs, reviewed weekly, beat a hundred metrics reviewed never. Production and collections tell you what happened. No-shows, unscheduled treatment, case acceptance, and chair utilization tell you what to fix this week.
Clinics that operationalize this short list recover revenue faster, run calmer morning huddles, and stop discovering $30,000 problems at month-end.
About Denzif
Denzif is cloud dental practice management for established small-to-mid clinics in Pakistan — patients, appointments, treatments, billing, inventory, WhatsApp reminders, and optional AI on Standard. Get custom PKR pricing or request a private walkthrough.
Frequently Asked Questions
Start with production vs monthly goal, collection rate (target 95%+), case acceptance (60–75%), hygiene reappointment (85–90%), no-show rate (under 8%), new patient count, production per provider hour, unscheduled accepted treatment value, chair utilization, and pending payment aging. These ten predict cash flow better than vanity social metrics.
Ready to put this into practice?
Custom PKR pricing for established clinics. Private walkthrough after we confirm fit. Setup in about 15 minutes.