Dental Analytics Platform: Compare Tools, KPIs, and What to Do Next (2026)
Standalone dental analytics runs $250–$600/mo — or comes built into your PMS. Compare Dental Intelligence, Jarvis, Practice by Numbers, and Denzif dashboards plus the 10 KPIs that matter.
Quick answer
A dental analytics platform pulls appointment, production, and billing data into live KPI dashboards — case acceptance, hygiene reappointment, no-shows, and unscheduled treatment value. Practices using dedicated analytics identify revenue gaps 40% faster than manual PMS reports. Denzif includes analytics in Pro at PKR 7,999 (~$29/month) without a separate subscription.
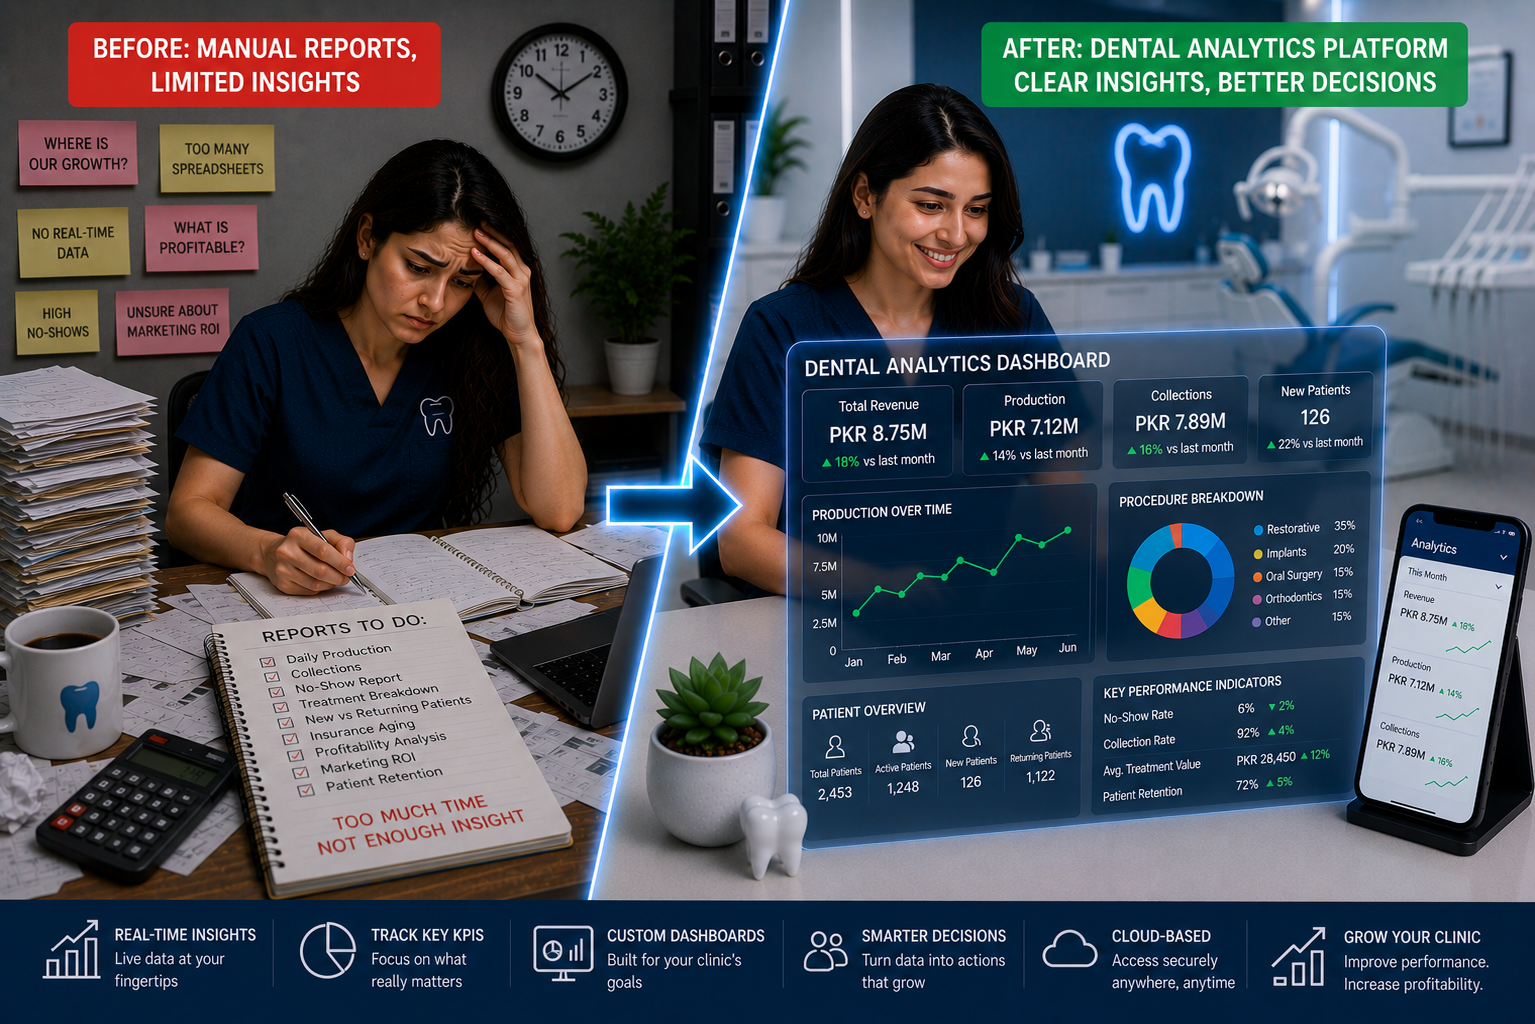
Your practice management system holds thousands of data points — but most owners still discover revenue leaks months late because reports live in export folders, not on a screen you check every morning.
A dental analytics platform fixes that: live dashboards for production, collections, case acceptance, no-shows, and unscheduled treatment — the numbers that actually change weekly behavior. This guide compares standalone tools vs built-in analytics, lists the KPIs worth tracking, and shows what to do when a metric turns red.
Key takeaways
- Dedicated analytics helps practices find revenue gaps 40% faster than manual PMS reports (ADA Health Policy Institute — cited in industry analyses).
- Standalone platforms (Dental Intelligence, Jarvis, Practice by Numbers) run $250–$600/month; built-in cloud dashboards can start near $29/month.
- Track 8–10 KPIs weekly — not 600 vanity metrics.
- Unscheduled treatment value and no-show rate are the fastest cash levers for most independents.
- Denzif Pro includes dental practice analytics — revenue, aging, no-shows, exports — no add-on fee.
- A dashboard without action is decoration — pair metrics with recall, reminders, and billing fixes.
What a dental analytics platform actually does
Beyond static PMS reports
Legacy practice software generates end-of-day reports — production summaries, appointment lists, aging AR. Useful, but static. You export, paste into Excel, and the data is stale before the morning huddle ends.
Modern analytics platforms (US Tech Automations, 2026) do three things basic reports do not:
1. Continuous sync — data updates through the day, not on manual export
2. Derived KPIs — case acceptance %, reappointment rate, production per hour by provider
3. Action triggers — recall campaigns when hygiene gaps appear; alerts when no-shows spike
Standalone vs built-in analytics
| Type | Examples | Typical cost | Best for |
|---|---|---|---|
| Standalone analytics | Dental Intelligence, Jarvis, Practice by Numbers | $250–$600/mo | Dentrix/Eaglesoft shops wanting deep KPI libraries |
| PMS-native analytics | Dentrix Profitability Insights, Curve dashboards | Bundled or $100–$300/mo add-on | Single-vendor loyalists |
| Cloud PMS built-in | Denzif, newer cloud suites | $29–$199/mo all-in | Clinics wanting one bill, no sync agent |
Dentrix's Profitability Insights Suite (powered by Jarvis Analytics) targets multi-location groups with near-real-time KPI drill-down — powerful, but priced for US enterprise budgets.
The 10 KPIs every owner should track weekly
Industry benchmarks from dental analytics leaders cluster around these targets:
| KPI | Target benchmark | Why it matters |
|---|---|---|
| Production vs monthly goal | 95–105% of target | Are you on pace before month-end panic? |
| Collection rate | 95%+ of net production | Billed work unpaid is not revenue |
| Case acceptance rate | 60–75% | Treatment presentation effectiveness |
| Hygiene reappointment rate | 85–90% | Recall pipeline and retention |
| No-show / cancellation rate | Under 8% | Direct daily production loss |
| Unscheduled accepted treatment | Under 2× monthly production | Cash waiting in the chart |
| New patients per month | Trend vs prior year | Marketing and referral health |
| Production per provider hour | Trend by dentist | Schedule and case-mix efficiency |
| Average production per visit | Trend | Upsell and comprehensive care signal |
| Pending payments (aging) | Drop week over week | Billing discipline |
You do not need all 600 KPIs that enterprise platforms advertise. Pick ten, review them every Monday, and assign one owner per red metric.
Leading dental analytics platforms compared
Dental Intelligence
Market leader for standalone dental analytics. Syncs with Dentrix, Eaglesoft, Open Dental, and Curve via a practice-server agent. Strengths: case acceptance by procedure code, morning huddle auto-briefings, hygiene retention dashboards. Typical cost: $300–$500/month per location in US pricing.
Best when: you are committed to a US legacy PMS and want the deepest pre-built dental KPI library.
Jarvis Analytics / Dentrix Profitability Insights
Jarvis powers Dentrix's enterprise analytics layer — multi-location roll-ups, provider scorecards, unscheduled treatment tracking. Strong for DSOs and regional managers comparing offices side by side.
Best when: you already pay Dentrix enterprise tiers and want zero third-party integration.
Practice by Numbers
Bundles analytics with patient communication — 600+ KPIs, Revenue Finder, daily huddle tools, and outreach automation in one stack (Practice by Numbers). Pricing often $400–$600/month all-in.
Best when: you want analytics plus automated patient campaigns from the same vendor.
Built-in cloud analytics (Denzif)
Denzif analytics ships inside Pro — no sync agent, no second subscription:
- Revenue by treatment type, dentist, and period
- Most profitable procedures ranking (when treatments link to invoices)
- Pending payments and aging overview
- No-show and cancellation trends
- New vs returning patient mix
- PDF and Excel export for accountants
PKR 7,999/month (~$29 USD) includes scheduling, records, billing, inventory, WhatsApp reminders, and the dashboard. Compare to dental software cost tiers before adding a $400 analytics line item.
How to read your dashboard — and act
Red metric: No-show rate above 10%
Diagnose: Which days? Which provider? New vs returning patients?
Act: Tighten WhatsApp reminder sequence (booking, 24h, 2h); enable two-way confirm/reschedule; review morning and late slots.
Measure: 30-day rolling no-show % — target under 8%.
Red metric: Unscheduled treatment above 2× monthly production
Diagnose: Sort open treatment plans by dollar value and age.
Act: Front desk calls top 20 plans this week; send WhatsApp summaries with estimated fees; offer financing clarity for high-ticket cases.
Measure: Dollars scheduled from previously open plans — weekly.
Red metric: Collection rate below 92%
Diagnose: Aging report — are balances patient responsibility or workflow gaps (no invoice same day)?
Act: Chairside invoicing SOP; payment recording at checkout; weekly AR huddle for balances over 30 days.
Measure: Collection rate and average days in AR.
Red metric: Case acceptance below 55%
Diagnose: Are plans presented visually? Same-day estimates? Payment options explained?
Act: Treatment plan presentation training; digital charts patients can see; follow-up within 48 hours on deferred cases.
Measure: Accepted vs presented treatment value monthly.
Standalone analytics vs Denzif — decision matrix
| Your situation | Recommendation |
|---|---|
| Single-location Pakistan clinic, cash billing | Denzif built-in analytics + WhatsApp reminders |
| Dentrix US practice, $500K+ production | Evaluate Dental Intelligence or Dentrix Insights |
| Multi-site DSO, 5+ locations | Jarvis / enterprise dashboard tier |
| Already paying $400/mo for analytics + comms | Audit usage — many clinics use 10% of features |
| Spreadsheet-only today | Move to cloud PMS with analytics first — skip standalone until data is clean |
Implementation: 30 days to data-driven mornings
Week 1 — Baseline: Export or screenshot current production, collections, no-shows, and AR. Assign KPI owners.
Week 2 — One dashboard: Log in daily; pin the four red metrics above. Cancel redundant spreadsheet reports.
Week 3 — One action per metric: No-show fix, AR chase list, unscheduled treatment calls, acceptance script refresh.
Week 4 — Review: Did production or collections move? If not, the problem is execution — not missing KPIs.
Pair with increase revenue without more chairs — analytics tells you which lever to pull first.
Pakistan clinic notes
- Cash and partial payments (udhaar) make collection rate the KPI that matters most — billed PKR 50,000 with PKR 30,000 collected is a 60% collection rate, not a revenue win.
- WhatsApp response time correlates with case acceptance — analytics plus messaging in one platform beats exporting CSVs to a standalone tool.
- Load-shedding favors cloud dashboards you can open on mobile during generator hours — not desktop-only reporting servers.
- Multi-dentist clinics need provider-level production — otherwise one associate's empty afternoons hide inside practice totals.
Common mistakes when buying analytics
Paying for depth you will not use
600 KPIs sound impressive. If your huddle reviews three numbers, you are funding shelfware.
Analytics without clean source data
Garbage in, garbage out. If treatments are not linked to invoices, no platform fixes profitability visibility — read signs your software is failing.
Dashboards that do not trigger action
The best platforms connect metrics to recall and outreach. A chart that shows a problem but sends no reminder is half a solution.
The Bottom Line
A dental analytics platform turns appointment, treatment, and billing data into weekly decisions — not month-end surprises. Standalone US tools deliver depth at $250–$600/month; cloud PMS platforms like Denzif bundle analytics at PKR 7,999 (~$29/month) when treatments and invoices already live in one system.
Pick ten KPIs, review them every Monday, and fix one red metric per week. Production follows discipline — not another spreadsheet export.
About Denzif
Denzif is cloud dental practice management for established small-to-mid clinics in Pakistan — patients, appointments, treatments, billing, inventory, WhatsApp reminders, and optional AI automation. Start your 7-day free trial or see pricing.
Frequently Asked Questions
It is software that connects to your practice management system (or is built into it) and surfaces KPIs — production, collections, case acceptance, no-shows, hygiene reappointment, and unscheduled treatment — in live dashboards instead of static end-of-month exports.
Ready to put this into practice?
Start your free 7-day Denzif trial. No credit card. Full access. Setup in 15 minutes.